
How to reconstruct pseudo IPD from a survival curve
The Kaplan–Meier curve is published. The patient-level data behind it are not.
This is a common problem in evidence generation. The individual participant data are typically considered commercially sensitive by the sponsor and remain unavailable.
We could debate whether this thwarts scientific progress, collaboration and, ultimately, patient outcomes. But this is the reality we find ourselves in, and that debate is another Insight in itself.
Even so, the published survival curve can often contain evidence needed for an indirect comparison or health economic model.[1,2]
A Kaplan–Meier curve is built from individual event times and censoring. With the curve and the information published alongside it, we can work backwards to reconstruct a dataset that closely reproduces the reported survival experience.[1,2]
This is called reconstructed pseudo individual patient data, or pseudo IPD.
The word pseudo matters. The process does not recover the sponsor’s original dataset. It creates a plausible set of survival times and event indicators that reproduce the published curve.
Here is how to do it.
HTA reviewers already reconstruct published survival curves
Curve reconstruction is not a workaround that sits outside HTA practice.
NICE Decision Support Unit Technical Support Document 14 says analysts should consider the Guyot reconstruction method when only summary survival information is available. It also describes assessment groups digitising published Kaplan–Meier curves when manufacturers held patient-level data but reviewers did not.[3]
The document was commissioned to support NICE technology appraisals, but it is technical support rather than formal NICE policy. It does not make every reconstruction acceptable. The source data, method, assumptions and validation still need to withstand scrutiny.
Here is a step-by-step guide to reconstructing pseudo IPD from a published survival curve.
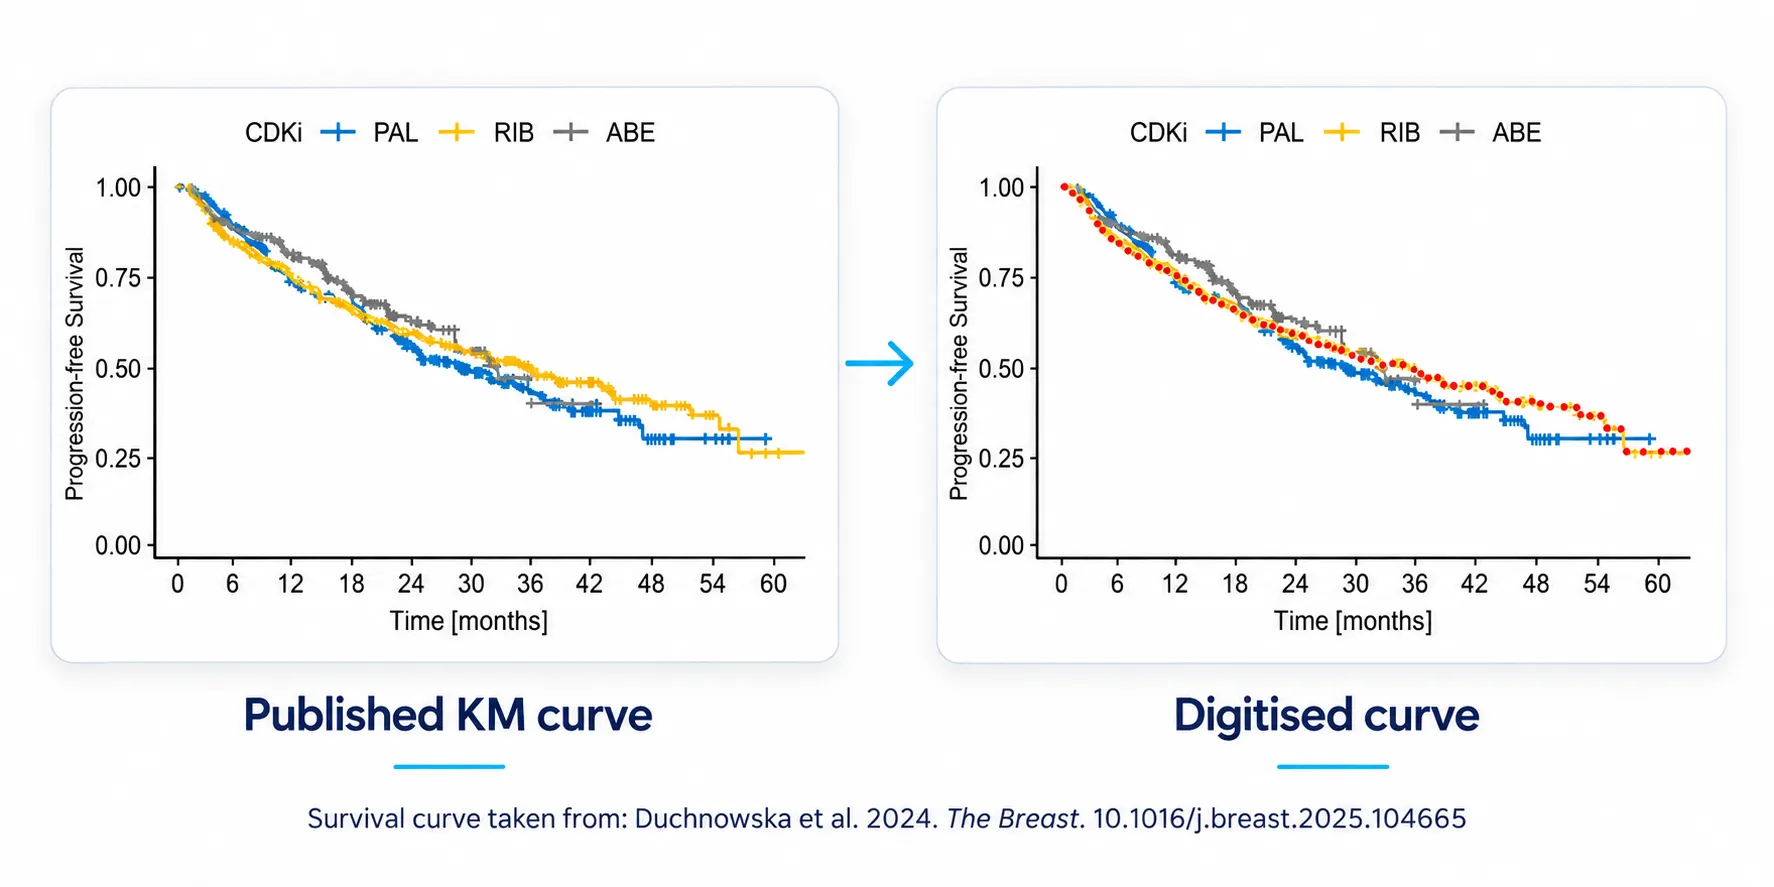
Step 1. Find the clearest version of the curve
Start with the highest-quality figure available. A vector PDF is preferable because it preserves the shape of the curve when enlarged. Pixelated images, blended colours and overlapping lines make the coordinates harder to recover accurately.[2,4]
Extract each treatment arm separately. If the curves overlap, isolate them before tracing where this can be done without altering their shape.
If the line cannot be followed reliably, the reconstruction may not be credible. Recognise that before building an analysis on it.
Step 2. Collect every supporting number
The curve is only one input.
For each treatment arm, collect:
-
The total number of patients
-
Every time point and count in the number-at-risk table
-
The total number of events, if reported
-
Any clearly marked censoring times
-
Reported median survival and survival rates at fixed times
-
The reported hazard ratio, when relevant
The numbers at risk are particularly important. The risk set falls when patients experience the event or are censored. The curve alone does not fully distinguish between them.[1,2]
Reconstruction may still run when the risk table or total event count is missing. That does not mean the result is equally reliable. Guyot and colleagues found that reconstructed hazard ratios became unreliable when neither source of information was available.[1]
Step 3. Digitise each curve carefully
Digitisation converts the line in the figure into pairs of numbers: a time and its corresponding survival probability.
First calibrate the horizontal and vertical axes. Then trace one treatment arm at a time.
The IPDfromKM authors recommend extracting as many points as possible, distributing them across the curve and capturing both the top and bottom of each vertical drop.[2]
Small tracing errors can matter. Check that the curve begins at the correct time and survival probability. Remove impossible coordinates and investigate any point that makes survival rise rather than fall.
Save the original image, the axis settings and the extracted coordinates. Someone else should be able to see exactly how the figure became data.
Step 4. Reconstruct the survival times and events
IPDfromKM divides reconstruction into two stages.[2]
First, it preprocesses the digitised coordinates. It orders the points, identifies implausible values and ensures that survival does not increase over time.
Second, it works backwards through the Kaplan–Meier calculations. It estimates the events and censored observations needed to reproduce the curve and the reported numbers at risk.
The resulting dataset normally contains three fields: survival time, whether the observation ended in an event or censoring, and the treatment arm.
That is enough for many survival analyses. It is not the original trial database.
Step 5. Treat censoring as an assumption
A patient is censored when they were observed up to a particular time but the event was not recorded during that period. They may have reached the end of follow-up or left observation for another reason.
Standard reconstruction methods do not usually know the exact censoring time for every patient. The Guyot and IPDfromKM approaches infer the censoring pattern using the numbers at risk and other published information. They assume that censoring occurs at a constant rate within each interval between the reported risk counts.[1,2]
Sometimes individual censoring times are marked on the curve with ticks or crosses. Rogula and colleagues developed a method that can incorporate those times directly when the marks are clear enough to digitise.[5]
That is not always possible. Marks may overlap, disappear beneath another curve or become crowded when the sample is large. If censoring has been estimated, present it as estimated. Do not write as though the exact times were observed.
Sparse risk tables and heavy censoring make the end of the curve especially fragile. Use sensitivity analyses when plausible alternative censoring patterns could change the result.[3-5]
Step 6. Rebuild the curve and check every number
Reconstructing a dataset is not the end of the process. The output must be checked against the publication.
Rebuild the Kaplan–Meier curve from the pseudo IPD and overlay it on the digitised curve. Then compare:
-
The numbers at risk
-
The total number of patients and events
-
Median survival
-
Survival at reported time points
-
The hazard ratio, when one was reported
IPDfromKM also provides numerical measures of the difference between the input and reconstructed survival probabilities.[2]
A close visual match is necessary, but it is not enough on its own. If the reconstructed data do not reproduce the supporting numbers, return to the digitisation and censoring assumptions.
Keep the curve, extracted coordinates, supporting data, software version, assumptions and validation outputs together. The audit trail is part of the analysis.
Step 7. Use the data only for questions they can answer
Reconstructed pseudo IPD can be used to recreate survival curves, estimate median or landmark survival, calculate restricted mean survival time, examine non-proportional hazards and fit survival models.[1,2,4,6]
This can support an indirect treatment comparison or provide survival inputs for a cost-effectiveness model.[1,5,6]
Pseudo IPD can supply the published comparator’s survival outcomes. If population adjustment is required, it must be performed using the trial for which true IPD are available, usually the developer’s own trial. Those patient data can be weighted or modelled to reflect the baseline characteristics reported for the comparator study.
But pseudo IPD reconstructed from a survival curve do not contain patient-level baseline characteristics.
A published baseline table may report the average age or the proportion of patients with severe disease. It does not tell you which characteristic belonged to each reconstructed survival time. The method therefore cannot recover the patient-level prognostic variables and treatment effect modifiers needed for covariate adjustment.[1,4,6]
That matters when comparing different studies. Two curves can be reconstructed accurately and still represent different populations, outcome definitions, starting points or treatment pathways.
As we explain in our insight on heterogeneity in indirect comparisons, adjustment cannot correct information that was never measured or reported.
Reconstruction solves a missing survival-data problem. It does not make two different studies comparable.
Take home
-
A published Kaplan–Meier curve can be used to reconstruct pseudo patient-level survival data when true IPD are unavailable.
-
Use the clearest curve available and collect the complete risk table, sample size, event count and censoring information.
-
Trace each curve carefully and retain a record of every input and decision.
-
Censoring is inferred unless clearly marked times can be incorporated. State the assumptions and test their effect.
-
Rebuild the curve and compare every available statistic with the original publication.
-
Pseudo IPD recover survival times and event status. They do not recover baseline prognostic variables or treatment effect modifiers.
References
-
Guyot P, Ades AE, Ouwens MJNM, Welton NJ. Enhanced secondary analysis of survival data: reconstructing the data from published Kaplan–Meier survival curves. BMC Medical Research Methodology. 2012;12:9. https://doi.org/10.1186/1471-2288-12-9
-
Liu N, Zhou Y, Lee JJ. IPDfromKM: reconstruct individual patient data from published Kaplan–Meier survival curves. BMC Medical Research Methodology. 2021;21:111. https://doi.org/10.1186/s12874-021-01308-8
-
Latimer N. NICE DSU Technical Support Document 14: Undertaking Survival Analysis for Economic Evaluations Alongside Clinical Trials: Extrapolation with Patient-Level Data. Decision Support Unit. 2011, last updated March 2013. http://www.nicedsu.org.uk
-
Tong G, Li F. Reconstructing pseudo individual patient-level data from published survival curves in cardiovascular trials. Journal of the American College of Cardiology. 2026;87(5):530-532. https://doi.org/10.1016/j.jacc.2025.12.060
-
Rogula B, Lozano-Ortega G, Johnston KM. A method for reconstructing individual patient data from Kaplan–Meier survival curves that incorporate marked censoring times. MDM Policy & Practice. 2022;7(1):23814683221077643. https://doi.org/10.1177/23814683221077643
-
Baio G. survHE: survival analysis for health economic evaluation and cost-effectiveness modeling. Journal of Statistical Software. 2020;95(14):1-47. https://doi.org/10.18637/jss.v095.i14